| Year | Results | ||||||||
|---|---|---|---|---|---|---|---|---|---|
| 2019 | |||||||||
| 2015 | |||||||||
| 2011 | |||||||||
| 2008 | |||||||||
| 2006 | |||||||||
| 2004 | |||||||||
| 2000 | |||||||||
| 1997 | |||||||||
| 1993 | |||||||||
| 1988 | |||||||||
| 1984 | |||||||||
| 1980 | |||||||||
| 1979 |
| Year | Results | ||||||||||||
|---|---|---|---|---|---|---|---|---|---|---|---|---|---|
| 1974 | |||||||||||||
| 1972 | |||||||||||||
| 1968 | |||||||||||||
| 1965 | |||||||||||||
| 1963 | |||||||||||||
| 1962 | |||||||||||||
| 1958 | |||||||||||||
| 1957 | |||||||||||||
| 1953 | |||||||||||||
| 1949 | |||||||||||||
| 1945 | |||||||||||||
| 1940 | |||||||||||||
| 1935 | |||||||||||||
| 1930 | |||||||||||||
| 1926 | |||||||||||||
| 1925 | |||||||||||||
| 1921 | |||||||||||||
| 1917 |
Canadian federal elections have provided the following results in Eastern Ontario.
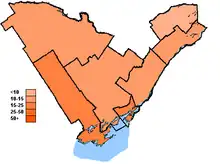
Regional profile
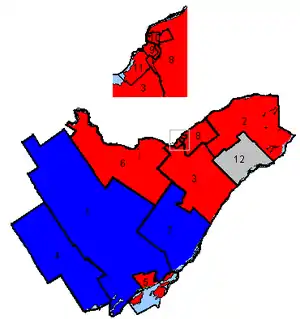
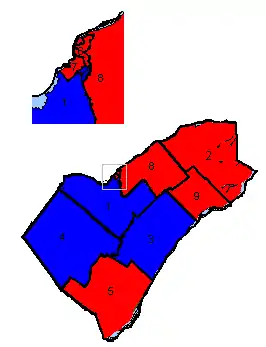
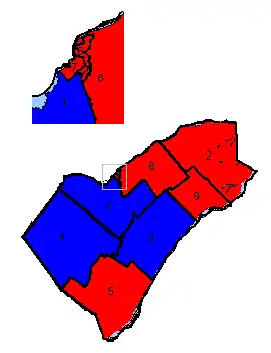
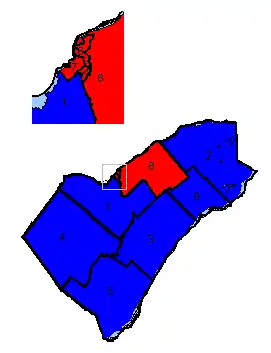
This mostly rural region has historically split between the Conservatives and Liberals, though vote-splitting led to a Liberal sweep in 1993 and 1997. The merge of the former Canadian Alliance and Progressive Conservative parties, however, saw the region swing rightward in the new millennium. Conservative parties gradually increased their seat numbers from 2004 onward, and by 2006 only the University City and largest urban area seat of Kingston and the Islands remained in Liberal hands.
In the 2011 election, the region was affected by the nationwide surge in support for the NDP. Although the NDP failed to win any seats in the area, they increased their popular vote share in all seven of the region's ridings, and won second place in three of the area's ridings.
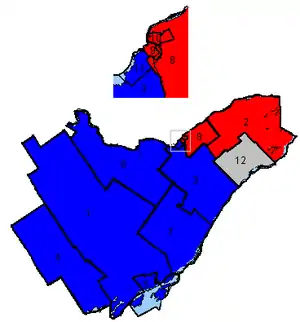
The Liberal wave that swept through Ontario in 2015 saw the Liberals take four seats in eastern Ontario, mostly in more urbanized areas (Kingston, Belleville, Hawkesbury). The Conservatives won the other four.
The 2019 election saw the Conservatives regain Hastings—Lennox and Addington, with the other seats remaining unchanged, resulting in the Conservatives winning five seats to the Liberals three.
2019 - 43rd General Election
| Electoral district | Candidates | Incumbent | ||||||||||||
|---|---|---|---|---|---|---|---|---|---|---|---|---|---|---|
| Liberal | Conservative | NDP | Green | PPC | Other | |||||||||
| Bay of Quinte | Neil Ellis 24,099 39.16% |
Tim Durkin 22,650 36.80% |
Stephanie Bell 9,851 16.01% |
Danny Celovsky 3,740 6.08% |
Paul Bordonaro 1,207 1.96% |
Neil Ellis | ||||||||
| Glengarry—Prescott—Russell | Francis Drouin 31,293 47.56% |
Pierre Lemieux 23,660 35.96% |
Konstantine Malakos 6,851 10.41% |
Marthe Lépine | Jean-Jacques Desgranges 1,174 1.78% |
Darcy Neal Donnelly (Libert.) 262 0.40% Daniel John Fey (Ind.) 239 0.36% Marc-Antoine Gagnier (Rhino.) 199 0.30% |
Francis Drouin | |||||||
| Hastings—Lennox and Addington | Mike Bossio 19,721 37.14% |
Derek Sloan 21,968 41.38% |
David Tough 6,984 13.15% |
Sari Watson 3,114 5.87% |
Adam L. E. Gray 1,307 2.46% |
Mike Bossio | ||||||||
| Kingston and the Islands | Mark Gerretsen 31,205 45.76% |
Ruslan Yakoviychuk 13,304 19.51% |
Barrington Walker 15,856 23.25% |
Candice Christmas 6,059 8.89% |
Andy Brooke 1,769 2.59% |
Mark Gerretsen | ||||||||
| Lanark—Frontenac—Kingston | Kayley Kennedy 15,441 24.71% |
Scott Reid 30,077 48.14% |
Satinka Schilling 8,835 14.14% |
Stephen Kotze 7,011 11.22% |
Matthew Barton 1,117 1.79% |
Scott Reid | ||||||||
| Leeds—Grenville—Thousand Islands and Rideau Lakes | Josh Bennett 15,482 26.49% |
Michael Barrett 28,630 48.98% |
Michelle Taylor 8,201 14.03% |
Lorraine Rekmans 5,152 8.81% |
Evan Hindle 988 1.69% |
Michael Barrett | ||||||||
| (federal electoral district)|Renfrew—Nipissing—Pembroke | Ruben Marini 11,532 19.56% |
Cheryl Gallant 31,080 52.72% |
Eileen Jones-Whyte 8,786 14.90% |
Ian Pineau 3,230 5.48% |
David Ainsworth 1,463 2.48% |
Robert Cherrin (VCP) 358 0.61% Dan Criger (Ind.) 1,125 1.91% Jonathan Davis (Ind.) 200 0.34% Dheerendra Kumar (Ind.) 917 1.56% Stefan Klietsch (Libert.) 266 0.45% |
Cheryl Gallant | |||||||
| Stormont—Dundas—South Glengarry | Heather Megill 13,767 25.63% |
Eric Duncan 28,976 53.95% |
Kelsey Catherine Schmitz 7,674 14.29% |
Raheem Aman 2,126 3.96% |
Sabile Trimm 1,168 2.17% |
Guy Lauzon†$ | ||||||||
2015 - 42nd General Election
| Electoral district | Candidates | Incumbent | ||||||||||
|---|---|---|---|---|---|---|---|---|---|---|---|---|
| Conservative | NDP | Liberal | Green | Other | ||||||||
| Bay of Quinte | Jodie Jenkins 19,781 34.27% |
Terry Cassidy 7,001 12.13% |
Neil Ellis 29,281 50.74% |
Rachel Nelems 1,278 2.21% |
Trueman Tuck (Ind.) 372 0.64% |
Daryl Kramp‡ Prince Edward—Hastings | ||||||
| Glengarry—Prescott— Russell |
Pierre Lemieux 23,367 36.41% |
Normand Laurin 5,087 7.93% |
Francis Drouin 34,189 53.28% |
Genevieve Malouin-Diraddo 1,153 1.80% |
Jean-Serge Brisson (Libert.) 377 0.59% |
Pierre Lemieux | ||||||
| Hastings— Lennox and Addington |
Daryl Kramp 20,879 41.93% |
Betty Bannon 6,348 12.75% |
Mike Bossio 21,104 42.38% |
Cam Mather 1,466 2.94% |
New District | |||||||
| Kingston and the Islands | Andy Brooke 14,928 22.70% |
Daniel Beals 11,185 17.01% |
Mark Gerretsen 36,421 55.37% |
Nathan Townend 2,933 4.46% |
Luke McAllister (Libert.) 305 0.46% |
Ted Hsu† | ||||||
| Lanark—Frontenac—Kingston | Scott Reid 27,399 47.87% |
John Fenik 8,073 14.10% |
Phil Archambault 19,325 33.76% |
Anita Payne 2,025 3.54% |
Mark Budd (Libert.) 418 0.73% |
Scott Reid Lanark—Frontenac—Lennox and Addington | ||||||
| Leeds—Grenville—Thousand Islands and Rideau Lakes | Gord Brown 26,738 47.38% |
Margaret Andrade 4,722 8.37% |
Mary Jean McFall 22,888 40.56% |
Lorraine A. Rekmans 2,088 3.70% |
Gord Brown Leeds—Grenville | |||||||
| |Renfrew—Nipissing— Pembroke |
Cheryl Gallant 26,195 45.83% |
Dan McCarthy 4,893 8.56% |
Jeff Lehoux 18,666 32.66% |
Stefan Klietsch 1,105 1.93% |
Hector Clouthier (Ind.) 6,300 11.02% |
Cheryl Gallant | ||||||
| Stormont—Dundas— South Glengarry |
Guy Lauzon 27,091 51.05% |
Patrick Burger 4,332 8.16% |
Bernadette Clement 20,452 38.54% |
Elaine Kennedy 1,191 2.24% |
Guy Lauzon | |||||||
2011 - 41st General Election
| Electoral district | Candidates | Incumbent | ||||||||||
|---|---|---|---|---|---|---|---|---|---|---|---|---|
| Conservative | Liberal | NDP | Green | Other | ||||||||
| Glengarry—Prescott— Russell |
Pierre Lemieux 28,174 48.80% |
Julie Bourgeois 17,705 30.67% |
Denis A. Séguin 9,608 16.64% |
Sylvie Lemieux 2,049 3.55% |
Jean-Serge Brisson (Libert.) 194 0.34% |
Pierre Lemieux | ||||||
| Kingston and the Islands | Alicia Gordon 21,189 34.93% |
Ted Hsu 23,842 39.31% |
Daniel Beals 13,065 21.54% |
Eric Walton 2,561 4.22% |
Peter Milliken† | |||||||
| Lanark—Frontenac— Lennox and Addington |
Scott Reid 33,754 57.27% |
David Remington 9,940 16.86% |
Doug Smyth 12,174 20.65% |
John Baranyi 2,702 4.58% |
Ralph Lee (Ind.) 370 0.63% |
Scott Reid | ||||||
| Leeds—Grenville | Gord Brown 29,991 60.81% |
Marjory Loveys 7,839 15.89% |
Matthew Gabriel 9,033 18.31% |
Mary Slade 2,460 4.99% |
Gord Brown | |||||||
| Prince Edward—Hastings | Daryl Kramp 29,062 53.25% |
Peter Tinsley 10,230 18.75% |
Michael McMahon 12,940 23.71% |
Patrick Larkin 1,887 3.46% |
Tim Hickey (Ind.) 283 0.52% |
Daryl Kramp | ||||||
| Andrew Skinner (PC) 171 0.31% | ||||||||||||
| |Renfrew—Nipissing— Pembroke |
Cheryl Gallant 27,462 53.43% |
Christine Tabbert 6,545 12.73% |
Eric Burton 6,903 13.43% |
Rosanne Van Schie 877 1.71% |
Hec Clouthier (Ind.) 9,611 18.70% |
Cheryl Gallant | ||||||
| Stormont—Dundas— South Glengarry |
Guy Lauzon 29,538 62.12% |
Bernadette Clement 8,510 17.90% |
Mario Leclerc 8,313 17.48% |
Wyatt Joseph Walsh 1,038 2.18% |
Darcy Neal Donnelly (Libert.) 151 0.32% |
Guy Lauzon | ||||||
2008 - 40th General Election
| Electoral district | Candidates | Incumbent | ||||||||||
|---|---|---|---|---|---|---|---|---|---|---|---|---|
| Conservative | Liberal | NDP | Green | Other | ||||||||
| Glengarry— Prescott— Russell |
Pierre Lemieux 25,659 47.30% |
Dan Boudria 19,997 36.87% |
Jean-Sébastien Caron 5,678 10.47% |
Sylvie Lemieux 2,908 5.36% |
Pierre Lemieux | |||||||
| Kingston and the Islands | Brian Abrams 18,895 32.54% |
Peter Milliken 22,734 39.15% |
Rick Downes 10,158 17.49% |
Eric Walton 6,282 10.82% |
Peter Milliken | |||||||
| Lanark— Frontenac— Lennox and Addington |
Scott Reid 30,272 55.88% |
David Remington 11,809 21.80% |
Sandra Willard 7,112 13.13% |
Chris Walker 4,629 8.55% |
Ernest Oliver Rathwell (Mar.) 347 0.64% |
Scott Reid | ||||||
| Leeds—Grenville | Gord Brown 27,473 58.44% |
Marjory Loveys 8,075 17.18% |
Steve Armstrong 6,511 13.85% |
Jeanie Warnock 4,522 9.62% |
John McCrea (PC) 426 0.91% |
Gord Brown | ||||||
| Prince Edward—Hastings | Daryl Kramp 26,061 50.19% |
Ken Cole 14,048 27.06% |
Michael McMahon 7,156 13.78% |
Alan Coxwell 4,379 8.43% |
Paul Barnes (Ind.) 276 0.53% |
Daryl Kramp | ||||||
| |Renfrew— Nipissing— Pembroke |
Cheryl Gallant 28,908 61.10% |
Carole Devine 9,737 20.58% |
Sue McSheffrey 5,175 10.94% |
Ben Hoffman 3,201 6.77% |
Denis Gagné (Ind.) 293 0.62% |
Cheryl Gallant | ||||||
| Stormont— Dundas— South Glengarry |
Guy Lauzon 25,846 57.34% |
Denis Sabourin 8,554 18.98% |
Darlene Jalbert 6,107 13.55% |
David Rawnsley 1,880 4.17% |
DWight Dugas (CAP) 105 0.23% |
Guy Lauzon | ||||||
| Howard Galganov (Ind.) 2,581 5.73% | ||||||||||||
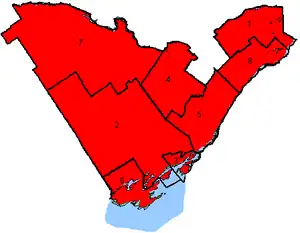
2006 - 39th General Election
 Map of the region's ridings. Colours show the result from the 2006 election |
|
| Electoral district | Candidates | Incumbent | ||||||||||
|---|---|---|---|---|---|---|---|---|---|---|---|---|
| Liberal | Conservative | NDP | Green | Other | ||||||||
| Glengarry— Prescott—Russell |
René Berthiaume 22,787 41.19% |
Pierre Lemieux 22,990 41.56% |
Jo-Ann Fennessey 7,049 12.74% |
Bonnie Jean-Louis 2,494 4.51% |
Don Boudria† | |||||||
| Kingston and the Islands | Peter Milliken 28,548 45.86% |
Lou Grimshaw 16,230 26.07% |
Rob Hutchison 11,946 19.19% |
Eric Walton 5,006 8.04% |
Don Rogers (CAP) 222 0.36% |
Peter Milliken | ||||||
| Karl Eric Walker (Ind.) 296 0.48% | ||||||||||||
| Lanark—Frontenac— Lennox and Addington |
Geoff Turner 14,709 24.74% |
Scott Reid 30,367 51.07% |
Helen Forsey 9,604 16.15% |
Mike Nickerson 3,115 5.24% |
Jerry Ackerman (CAP) 429 0.72% |
Scott Reid | ||||||
| Jeffrey Bogaerts (PC) 735 1.24% | ||||||||||||
| Ernest Rathwell (Mar.) 501 0.84% | ||||||||||||
| Leeds—Grenville | Bob Eaton 12,661 24.32% |
Gord Brown 28,447 54.65% |
Steve Armstrong 7,945 15.26% |
David Lee 3,003 5.77% |
Gord Brown | |||||||
| Prince Edward—Hastings | Bob Vaughan 18.034 31.58% |
Daryl Kramp 27,787 48.67% |
Michael McMahon 8,474 14.84% |
Joseph Sahadat 2,386 4.18% |
Tim Hickey (Ind.) 416 0.73% |
Daryl Kramp | ||||||
| |Renfrew—Nipissing— Pembroke |
Don Lindsay 12,532 24.16% |
Cheryl Gallant 29,923 57.69% |
Sue McSheffrey 6,509 12.55% |
Gordon Scott McLeod 1,605 3.09% |
Paul Kelly (Ind.) 1,304 2.51% |
Cheryl Gallant | ||||||
| Stormont—Dundas— South Glengarry |
Tom Manley 13,906 27.17% |
Guy Lauzon 28,014 54.73% |
Elaine MacDonald 6,892 13.46% |
Doug Beards 1,713 3.35% |
Carson Chisholm (CHP) 663 1.30% |
Guy Lauzon | ||||||
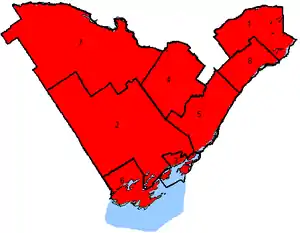
2004 - 38th General Election
 Map of the region's ridings in 2004. Colours show the result from the 2004 election |
|
| Electoral district | Candidates | Incumbent | ||||||||||
|---|---|---|---|---|---|---|---|---|---|---|---|---|
| Liberal | Conservative | NDP | Green | Other | ||||||||
| Glengarry— Prescott—Russell |
Don Boudria 23,921 47.86% |
Alain Lalonde 18,729 37.47% |
Martin Cauvier 4,238 8.48% |
Roy Fjarlie 2,634 5.27% |
Tim Bloedow (CHP) 464 0.93% |
Don Boudria | ||||||
| Kingston and the Islands | Peter Milliken 28,544 52.45% |
Blair MacLean 12,582 23.12% |
Rob Hutchison 8,964 16.47% |
Janina Fisher Balfour 3,339 6.13% |
Rosie The Clown Elston (Ind.) 237 0.44% |
Peter Milliken | ||||||
| Terry Marshall (CHP) 481 0.88% | ||||||||||||
| Don Rogers (CAP) 179 0.33% | ||||||||||||
| Karl Eric Walker (Ind.) 100 0.18% | ||||||||||||
| Lanark—Frontenac— Lennox and Addington |
Larry McCormick 17,507 30.97% |
Scott Jeffrey Reid 27,566 48.77% |
Ross Sutherland 7,418 13.12% |
John Baranyi 2,736 4.84% |
George Walter Kolaczynski (Mar.) 479 0.85% ———— Bill Vankoughnet (Ind.) 820 1.45% |
Larry McCormick | ||||||
| merged district | ||||||||||||
| Scott Reid | ||||||||||||
| Leeds—Grenville | Joe Jordan 16,967 32.93% |
Gord Brown 26,002 50.46% |
Steve Armstrong 5,834 11.32% |
Chris Bradshaw 2,722 5.28% |
Joe Jordan | |||||||
| Prince Edward—Hastings | Bruce Knutson 20,042 37.57% |
Daryl Kramp 22,598 42.36% |
Dan Douglas 8,105 15.19% |
Tom Lawson 2,130 3.99% |
Joseph Sahadat (Ind.) 468 0.88% |
Lyle Vanclief† | ||||||
| |Renfrew—Nipissing— Pembroke |
Rob Jamieson 14,798 29.65% |
Cheryl Gallant 27,494 55.08% |
Sue McSheffrey 5,720 11.46% |
Gordon S McLeod 1,191 2.39% |
Stanley Sambey (Mar.) 714 1.43% |
Cheryl Gallant | ||||||
| Stormont—Dundas— South Glengarry |
Bob Kilger 17,779 36.78% |
Guy Lauzon 21,678 44.85% |
Elaine MacDonald 5,387 11.15% |
Tom Manley 3,491 7.22% |
Bob Kilger | |||||||
 Conservative Party of Canada |
 Green Party of Canada |
 Liberal Party of Canada |
 New Democratic Party |
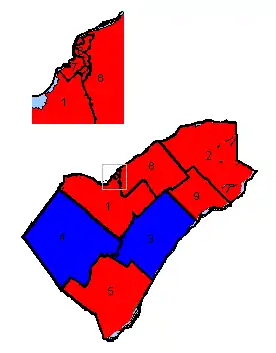
2000 - 37th General Election
 Map of the region's ridings in 2000. Colours show the result from the 2000 election |
|
| Electoral district | Candidates | Incumbent | ||||||||||||||
|---|---|---|---|---|---|---|---|---|---|---|---|---|---|---|---|---|
| Liberal | Canadian Alliance | NDP | PC | Canadian Action | No Affiliation | Other | ||||||||||
| Glengarry—Prescott—Russell | Don Boudria 31,371 67.96% |
L. Sebastian Anders 8,632 18.70% |
Guy Belle-Isle 1,877 4.07% |
Ashley O'Kurley 3,942 8.54% |
Wayne Foster (NLP) 340 0.74% |
Don Boudria | ||||||||||
| Hastings—Frontenac—Lennox and Addington | Larry McCormick 16,996 39.00% |
Sean McAdam 13,227 30.35% |
Tom O'Neill 2,200 5.05% |
Daryl Kramp 10,231 23.48% |
Paul Isaacs (CAP) 156 0.36% |
Ross Baker (Ind.) 207 0.48% Kenneth Switzer 43 0.10% |
Chris Walker (Green) 516 1.18% |
Larry McCormick | ||||||||
| Kingston and the Islands | Peter Milliken 26,457 51.69% |
Kevin Goligher 7,904 15.44% |
Gary Wilson 4,951 9.67% |
Blair MacLean 9,222 18.02% |
Chris Milburn (Green) 2,652 5.18% |
Peter Milliken | ||||||||||
| Lanark—Carleton | Ian Murray 22,811 35.99% |
Scott Reid 24,670 38.93% |
Theresa Kiefer 1,946 3.07% |
Bryan Brulotte 12,430 19.61% |
Ross Elliott (CAP) 388 0.61% |
John Baranyi (Ind.) 150 0.24% |
Stuart Langstaff (Green) 871 1.37% Britt Roberts (NLP) 107 0.17% |
Ian Murray | ||||||||
| Leeds—Grenville | Joe Jordan 18,594 39.51% |
Gord Brown 18,539 39.39% |
Martin Hanratty 990 2.10% |
John M. Johnston 7,940 16.87% |
Jane Pamela Scharf (CAP) 181 0.38% |
Jerry Heath (Green) 816 1.73% |
Joe Jordan | |||||||||
| Prince Edward—Hastings | Lyle Vanclief 20,055 50.46% |
Jim Graham 9,707 24.43% |
Jason Gannon 1,897 4.77% |
Dennis Timbrell 8,083 20.34% |
Lyle Vanclief | |||||||||||
| (federal electoral district)|Renfrew—Nipissing—Pembroke | Hec Clouthier 18,211 39.00% |
Cheryl Gallant 20,634 44.18% |
Ole Hendrickson 1,607 3.44% |
Bob Amaron 5,287 11.32% |
Thane C. Heins 121 0.26% |
André Giordano (NLP) 78 0.17% Stanley E. Sambey (Mar.) 762 1.63% |
Hec Clouthier | |||||||||
| Stormont—Dundas— Charlottenburgh |
Bob Kilger 19,113 46.69% |
Guy Lauzon 16,151 39.45% |
Kimberley Fry 1,696 4.14% |
Michael Bailey 3,635 8.88% |
Georges Elie Novy (CAP) 127 0.31% |
Ian Campbell (NLP) 214 0.52% |
Bob Kilger | |||||||||
1997 - 36th General Election
 Map of the region's ridings in 1997. Colours show the result from the 1997 election |
|
| Electoral district | Candidates | Incumbent | ||||||||||
|---|---|---|---|---|---|---|---|---|---|---|---|---|
| Liberal | Reform | NDP | PC | Other | ||||||||
| Glengarry— Prescott—Russell |
Don Boudria 34,986 |
Mike Lancop 4,599 |
Fred Cappuccino 2,289 |
France Somers 6,109 |
Richard Kerr (Green) 417 Mary L. Glasser (NLP) 207 |
Don Boudria | ||||||
| Hastings—Frontenac— Lennox and Addington |
Larry McCormick 18,399 |
Sean McAdam 12,045 |
Robert Snefjella 3,255 |
Daryl Kramp 12,227 |
Kenneth Switzer (CHP) 505 Lester Newby (NLP) 189 |
Larry McCormick | ||||||
| Kingston and the Islands | Peter Milliken 25,632 |
Dave Clarke 6,761 |
Gary Wilson 6,433 |
Helen Cooper 11,296 |
Chris Walker (Green) 902 Terry Marshall (CHP) 751 |
Peter Milliken | ||||||
| Lanark—Carleton | Ian Murray 28,151 |
Darrel Robert Reid 16,765 |
Gail Myles 3,022 |
Bryce Grayson Bell 13,213 |
Susan Brandum (Green) 463 Gerald W. LePage (CAP) 318 Britt Roberts (NLP) 181 |
Ian Murray | ||||||
| Leeds—Grenville | Joe Jordan 19,123 |
Doug Aldridge 10,476 |
Jennifer Breakspear 1,757 |
Sandra Lawn 15,636 |
Peter Bevan-Baker (Green) 1,102 Donny F. Platt (CHP) 241 Wayne Foster (NLP) 119 |
Jim Jordan † | ||||||
| Prince Edward—Hastings | Lyle Vanclief 22,415 |
Lloyd Lewis 9,219 |
Barb Dolan 2,512 |
Dennis Timbrell 9,305 |
Lyle Vanclief | |||||||
| |Renfrew—Nipissing— Pembroke |
Hec Clouthier 19,569 |
Ed Pinnell 13,035 |
Barbara Clarke 3,242 |
Bob Gould 12,352 |
Gay Curran-Desmond (CAP) 236 André Giordano (NLP) 183 |
Len Hopkins † | ||||||
| Stormont—Dundas | Bob Kilger 22,857 |
Charles Dillabough 8,945 |
Sydney Gardiner 2,671 |
Leslie O'Shaughnessy 8,741 |
Ian Campbell (NLP) 295 |
Bob Kilger | ||||||
1993 - 35th General Election
 Map of the region's ridings in 1993. Colours show the result from the 1993 election |
|
| Electoral district | Candidates | Incumbent | ||||||||||
|---|---|---|---|---|---|---|---|---|---|---|---|---|
| PC | Liberal | NDP | Reform | Other | ||||||||
| Glengarry— Prescott—Russell |
France Somers 4,572 |
Don Boudria 44,775 |
Pascal Villeneuve 1,304 |
Sam McCracken 4,456 |
Pierrette Blondin (NLP) 473 Jean-Serge Brisson (Lbt.) 244 |
Don Boudria | ||||||
| Hastings—Frontenac— Lennox and Addington |
Bill Vankoughnet 10,963 |
Larry McCormick 24,085 |
Bett Hay Lambeck 2,012 |
Stephen Ollerenshaw 8,851 |
Bob Hilson (Nat.) 997 T. Cheemo The Clown Walczak (Ind.) 752 Ross Baker (Ind.) 413 |
Bill Vankoughnet | ||||||
| Kingston and the Islands | Barry Gordon 10,088 |
Peter Milliken 30,336 |
Mary Ann Higgins 3,700 |
Sean McAdam 6,740 |
Chris Papadopoulos (Nat.) 1,643 Terry M. Marshall (CHP) 645 Chris Wilson (NLP) 339 |
Peter Milliken | ||||||
| Lanark—Carleton | Paul Dick 16,604 |
Ian Murray 35,051 |
Judie McSkimmings 1,689 |
Ron Macdonald 15,766 |
Jacques Rubacha (Nat.) 926 Stephen Johns (Green) 329 Britt Roberts (NLP) 264 Barbara Rowe (Lbt.) 99 Bracken Begley (Abol.) 62 |
Paul Dick | ||||||
| Leeds—Grenville | Sandra Lawn 13,595 |
Jim Jordan 26,324 |
Mary Ann Greenwood 999 |
Paul West 7,975 |
Peter Bevan-Baker (Green) 527 Holly Baker (Nat.) 481 Richard Beecroft (NLP) 196 Christine M. Richardson (Abol.) 56 |
Jim Jordan | ||||||
| Prince Edward—Hastings | Jim Hughes 8,245 |
Lyle Vanclief 26,483 |
Jim Martin 1,275 |
Marjorie Foster 9,019 |
Christine Kosman (Nat.) 639 Dave Switzer (CHP) 556 Siggi Lamothe (NLP) 171 |
Lyle Vanclief | ||||||
| |Renfrew—Nipissing— Pembroke |
Milton Stevenson 7,039 |
Len Hopkins 25,725 |
Barbara Clarke 1,345 |
Edward Pinnell 6,209 |
Hec Clouthier (Ind.) 10,287 Murray Reid (Abol.) 145 Daphne Quance (NLP) 143 |
Len Hopkins | ||||||
| Stormont—Dundas | Leslie Ault 7,499 |
Bob Kilger 27,055 |
David Moss 1,147 |
Annette Turner 5,858 |
Andy Boyle (Nat.) 580 Ian Campbell (NLP) 425 Reginald Landry (PCC) 79 |
Bob Kilger | ||||||
1988 - 34th General Election
 Map of the region's ridings in 1988. Colours show the result from the 1988 election |
|
| Electoral district | Candidates | Incumbent | ||||||||
|---|---|---|---|---|---|---|---|---|---|---|
| PC | Liberal | NDP | Other | |||||||
| Glengarry— Prescott—Russell |
Roger R. Presseault 9,517 |
Don Boudria 35,280 |
Helena McCuaig 4,537 |
Jean-Serge Brisson (Lbt.) 335 John Feres (PCC) |
Don Boudria | |||||
| Hastings—Frontenac— Lennox and Addington |
Bill Vankoughnet 17,247 |
Earl Smith 16,379 |
Bud Acton 7,455 |
Richard Welsman (CHP) 1,598 Ross Baker (Ind.) 478 |
Bill Vankoughnet | |||||
| Kingston and the Islands | Flora MacDonald 20,409 |
Peter Milliken 23,121 |
Len Johnson 11,442 |
Terry Marshall (CHP) 1,646 John Hayes (Lbt.) 301 |
Flora MacDonald | |||||
| Lanark—Carleton | Paul Dick 27,379 |
Janet Marshall 20,275 |
Bill Cox 8,359 |
Robert Stratton (CRWP) 981 |
Paul Dick | |||||
| Leeds—Grenville | Jennifer Cossitt 18,053 |
Jim Jordan 20,141 |
Barry Grills 5,141 |
David J. Butcher (CHP) 1,584 Faye Garner (CRWP) 1,497 |
Jennifer Cossitt | |||||
| Prince Edward—Hastings | Jack Arthur 16,408 |
Lyle Vanclief 19,559 |
Don Wilson 6,564 |
John B. Herring (CHP) 2,063 Doug Grant (CRWP) 522 Heather-Anne Lapsley (Lbt.) 229 |
Jack Ellis † | |||||
| Renfrew | Ben Hoffman 15,081 |
Len Hopkins 25,558 |
Elizabeth Ives-Ruyter 5,879 |
Murray Reid (CRWP) 520 |
Len Hopkins | |||||
| Stormont—Dundas | Eric J. Cameron 12,572 |
Bob Kilger 19,698 |
Steve J. Corrie 5,448 |
Bob Noble (CRWP) 5,135 |
Norm Warner † | |||||
1984 - 33rd General Election
 Map of the region's ridings in 1984. Colours show the result from the 1984 election |
|
| Electoral district | Candidates | Incumbent | ||||||||
|---|---|---|---|---|---|---|---|---|---|---|
| Liberal | PC | NDP | Other | |||||||
| Glengarry— Prescott—Russell |
Don Boudria 26,057 |
John Stante 16,170 |
Annemarie Collard 6,838 |
Denis Éthier † | ||||||
| Hastings—Frontenac— Lennox and Addington |
Ron Vastokas 9,757 |
Bill Vankoughnet 19,996 |
Donna Forth 5,349 |
Ross Baker (Ind.) 441 |
Bill Vankoughnet | |||||
| Kingston and the Islands | George N. Speal 13,087 |
Flora MacDonald 25,997 |
Andrew Currie 5,950 |
Daniel Eardley (N/A) 1,410 E.J. Ted Bond (Green) 478 Ian Murray (Lbt.) 258 |
Flora MacDonald | |||||
| Lanark—Renfrew—Carleton | Brooke McNabb 15,528 |
Paul Dick 24,395 |
Don Page 5,310 |
Floyd J. Craig (PCC) 139 |
Paul Dick | |||||
| Leeds—Grenville | Chuck Anderson 10,222 |
Jennifer Cossitt 26,961 |
Jan Allen 6,121 |
Mike Nickerson (Green) 348 Hans Wienhold (Lbt.) 190 |
Jennifer Cossitt | |||||
| Prince Edward—Hastings | Robert Scott 10,321 |
Jack Ellis 21,034 |
Don Wilson 7,162 |
George Nip Casey (Ind.) 197 |
Jack Ellis | |||||
| (federal electoral district)|Renfrew—Nipissing—Pembroke | Len Hopkins 19,502 |
Don Whillans 19,464 |
Gavin Murphy 4,253 |
Len Hopkins | ||||||
| Stormont—Dundas | Ed Lumley 18,821 |
Norm Warner 21,043 |
Raymond Lefebvre 5,869 |
Ed Lumley | ||||||
1980 - 32nd General Election
 Map of the region's ridings in 1980. Colours show the result from the 1980 election |
|
| Electoral district | Candidates | Incumbent | ||||||||
|---|---|---|---|---|---|---|---|---|---|---|
| PC | Liberal | NDP | Other | |||||||
| Glengarry— Prescott—Russell |
Gordon Johnson 8,113 |
Denis Éthier 28,189 |
Claude Dion 4,781 |
Gary O'Brien (M-L) 90 |
Denis Éthier | |||||
| Hastings—Frontenac | Bill Vankoughnet 14,211 |
Ron Vastokas 13,132 |
Kevin Arsenault 5,895 |
Ross Baker (Ind.) 342 |
Bill Vankoughnet | |||||
| Kingston and the Islands | Flora MacDonald 18,146 |
John Coleman 17,039 |
Stephen Foster 7,830 |
Edward T. Sharp (Rhino.) 373 |
Flora MacDonald | |||||
| Lanark—Renfrew—Carleton | Paul Dick 20,487 |
Pat Carroll 11,817 |
Gord Gilhuly 4,948 |
Stuart Neilson (N/A) 247 |
Paul Dick | |||||
| Leeds—Grenville | Tom Cossitt 19,800 |
Gerry McKee 12,260 |
Mildred Smith 6,600 |
Tom Cossitt | ||||||
| Prince Edward—Hastings | Jack Ellis 16,893 |
Ben Prinzen 12,821 |
Don Wilson 6,889 |
Bill Hawthorne (Ind.) 211 |
Jack Ellis | |||||
| (federal electoral district)|Renfrew—Nipissing—Pembroke | Bob Amaron 12,966 |
Leonard Hopkins 20,529 |
Don Breault 6,200 |
Leonard Hopkins | ||||||
| Stormont—Dundas | James C. Bredin 15,089 |
Ed Lumley 22,251 |
Maurice Labelle 4,629 |
Ed Lumley | ||||||
1979 - 31st General Election
Map of the region's ridings in 1979. Colours show the result from the 1979 election |
|
| Electoral district | Candidates | Incumbent | ||||||||
|---|---|---|---|---|---|---|---|---|---|---|
| Liberal | PC | NDP | Other | |||||||
| Glengarry— Prescott—Russell |
Denis Éthier 27,106 |
Gordon Johnson 10,112 |
Paul de Broeck 4,164 |
Gary O'Brien (M-L) 107 |
Denis Éthier | |||||
| Hastings—Frontenac | Ron Vastokas 11,176 |
Bill Vankoughnet 17,537 |
Kevin Arsenault 5,691 |
Ross Baker (Ind.) 417 |
Douglas Alkenbrack † | |||||
| Kingston and the Islands | Peter Beeman 14,866 |
Flora MacDonald 21,277 |
Stephen Foster 8,472 |
Flora MacDonald | ||||||
| Lanark—Renfrew—Carleton | Pat Carroll 10,485 |
Paul Dick 24,277 |
Gord Gilhuly 5,749 |
Paul Dick | ||||||
| Leeds—Grenville | Gerry McKee 11,797 |
Tom Cossitt 24,127 |
Mildred Smith 6,551 |
Tom Cossitt | ||||||
| Prince Edward—Hastings | Kay Manderville 12,394 |
Jack Ellis 21,088 |
Don Wilson 5,833 |
William R. Hawthorne (Ind.) 261 |
Jack Ellis | |||||
| (federal electoral district)|Renfrew—Nipissing—Pembroke | Leonard D. Hopkins 20,286 |
Don Sutherland 13,781 |
Don Breault 7,133 |
Leonard D. Hopkins | ||||||
| Stormont—Dundas | Ed Lumley 20,581 |
Dick Aubry 17,575 |
Brian Peters 5,568 |
Ed Lumley | ||||||
1974 - 30th General Election
 Map of the region's ridings in 1974. Colours show the result from the 1974 election |
|
| Electoral district | Candidates | Incumbent | ||||||||
|---|---|---|---|---|---|---|---|---|---|---|
| Liberal | PC | NDP | Other | |||||||
| Frontenac—Lennox and Addington | Grace Stalker 10,961 |
Douglas Alkenbrack 14,102 |
William Bud Acton 4,157 |
Douglas Alkenbrack | ||||||
| Glengarry— Prescott—Russell |
Denis Éthier 18,478 |
Bernard Pelot 6,595 |
Raymond Desrochers 5,484 |
Denis Éthier | ||||||
| Grenville—Carleton | Jim McDonald 22,803 |
Walter Baker 33,946 |
Joan Kabayama 5,679 |
Walter Baker | ||||||
| Hastings | Marie Kurchak 12,474 |
Jack Ellis 14,893 |
Bob Sanders 3,382 |
Floyd Hawley (S.C.) 194 |
Jack Ellis | |||||
| Kingston and the Islands | Peter Watson 13,943 |
Flora MacDonald 17,839 |
Lars Thompson 6,870 |
Flora MacDonald | ||||||
| Lanark—Renfrew—Carleton | Bud Barrett 13,009 |
Paul Dick 18,242 |
Stuart Morrison 3,428 |
Paul Dick | ||||||
| Leeds | Donna M. Healey 10,845 |
Tom Cossitt 17,744 |
Keith Sutcliffe 4,659 |
Tom Cossitt | ||||||
| Ottawa—Carleton | John N. Turner 38,463 |
Bill Neville 27,588 |
Dave Hall 6,014 |
John N. Turner | ||||||
| Ottawa Centre | Hugh Poulin 15,308 |
Hugh Segal 12,138 |
Irving Greenberg 6,739 |
Bela Egyed (Waffle) 877 John Graham (S.C.) 139 Ray Quann (Libertarian) 63 Phil Sarazen (M-L) 62 |
Hugh Poulin | |||||
| Ottawa—Vanier | Jean-Robert Gauthier 21,773 |
Claude L. Choquette 5,603 |
Paul H. Michaud 3,298 |
Cyril E. Gauthier (S.C.) 976 Judith T. Haddad (Ind.) 114 Edmond Irani (Ind.) 107 |
Jean-Robert Gauthier | |||||
| Ottawa West | Lloyd Francis 23,604 |
Peter Reilly 21,838 |
Doris Shackleton 6,480 |
Lawrence F. Sullivan (Canada) 432 Jacques Lapointe (S.C.) 192 Jean Greatbatch (Comm.) 78 Richard Bowen (M-L) 67 |
Peter Reilly | |||||
| Stormont—Dundas | Ed Lumley 18,047 |
Fern Guindon 13,895 |
James Freeman 2,587 |
Lucien Lamoureux † | ||||||
1972 - 29th General Election
 Map of the region's ridings in 1972. Colours show the result from the 1972 election |
|
| Electoral district | Candidates | Incumbent | |||||||||
|---|---|---|---|---|---|---|---|---|---|---|---|
| Liberal | PC | NDP | Other | ||||||||
| Frontenac—Lennox and Addington | Peter MacKinnon 9,206 |
Douglas Alkenbrack 16,563 |
Mary Lloyd-Jones 3,283 |
Douglas Alkenbrack | |||||||
| Glengarry— Prescott—Russell |
Denis Éthier 14,780 |
J.-L. Montreuil 6,924 |
Jacques Boyer 2,495 |
Bernard Pelot (Ind.) 2,478 W.-R. Marin (S.C.) 1,710 |
Viateur Éthier † | ||||||
| Grenville—Carleton | Gordon Blair 22,026 |
Walter Baker 32,689 |
Joan Kabayama 6,405 |
Gordon Blair | |||||||
| Hastings | Frank Follwell 11,391 |
Jack Ellis 16,591 |
Elridge G. Brethour 3,378 |
Lee Grills † | |||||||
| Kingston and the Islands | John Hazlett 14,079 |
Flora MacDonald 22,824 |
Lars Thompson 5,807 |
Edgar John Benson † | |||||||
| Lanark—Renfrew—Carleton | Murray McBride 13,283 |
Paul Dick 17,893 |
Henry Mellema 1,819 |
Murray McBride | |||||||
| Leeds | Gervis Black 10,650 |
Tom Cossitt 18,130 |
Keith Sutcliffe 4,850 |
Desmond Code † | |||||||
| Ottawa—Carleton | John N. Turner 31,316 |
Strome Galloway 22,641 |
Doris Shackleton 11,225 |
David Morse (S.C.) 839 |
John N. Turner | ||||||
| Ottawa Centre | Hugh Poulin 14,101 |
Hugh Segal 12,899 |
Irving Greenberg 9,195 |
Rocco Zavarella (S.C.) 237 Paul Herman (N/A) 177 |
George McIlraith † | ||||||
| Ottawa East | Jean-Robert Gauthier 20,446 |
Gerry Valiquette 6,029 |
François Beaulne 4,672 |
Cyril Gauthier (S.C.) 1,229 David S. White (Ind.) 208 |
J.-T. Richard † | ||||||
| Ottawa West | Lloyd Francis 18,423 |
Peter Reilly 22,169 |
Pauline Jewett 13,498 |
Priscilla Hamelin (S.C.) 245 |
Lloyd Francis | ||||||
| Stormont—Dundas | Grant Campbell 12,364 |
Murray Forsyth 3,108 |
138 |
Lucien Lamoureux | |||||||
1968 - 28th General Election
 Map of the region's ridings in 1968. Colours show the result from the 1968 election |
|
| Electoral district | Candidates | Incumbent | ||||||||
|---|---|---|---|---|---|---|---|---|---|---|
| Liberal | PC | NDP | Other | |||||||
| Frontenac—Lennox and Addington | Peter C. Connolly 9,953 |
Douglas Alkenbrack 11,801 |
John Moss 2,730 |
Clarence A. Mulligan (Ind. P.C.) 571 |
Douglas Alkenbrack | |||||
| Glengarry—Prescott | Viateur Éthier 14,970 |
J.-Lomer Carriere 7,564 |
Claude Demers 1,606 |
Viateur Éthier | ||||||
| Grenville—Carleton | Gordon Blair 21,250 |
Jean Wadds 18,843 |
David Bell 3,887 |
Dick Bell † | ||||||
| merged district | ||||||||||
| Jean Wadds | ||||||||||
| Hastings | Robert Temple 10,875 |
Lee Grills 13,555 |
Donald G. Burshaw 3,195 |
Lee Grills | ||||||
| Kingston and the Islands | Edgar John Benson 16,234 |
Bogart W. Trumpour 11,799 |
Brendan McConnell 4,636 |
Edgar John Benson | ||||||
| Lanark and Renfrew | Murray McBride 13,156 |
James W. Baskin 12,737 |
James Ronson 1,861 |
Joe Greene (running in Niagara Falls) | ||||||
| Leeds | Ross Matheson 13,532 |
Desmond Code 13,536 |
Clayton C. Graves 2,005 |
Ross Matheson | ||||||
| Ottawa—Carleton | John N. Turner 28,987 |
Ken Binks 11,665 |
Harold Wilson 3,115 |
Paul Tardif † | ||||||
| Ottawa Centre | George McIlraith 19,578 |
Murray A. Heit 11,602 |
June B. Ralph 2,729 |
new district | ||||||
| Ottawa East | J.-T. Richard 26,170 |
Rex Le Lacheur 4,168 |
Ian Macdonald 2,921 |
J.-T. Richard | ||||||
| Ottawa West | Lloyd Francis 23,750 |
Dick Bell 16,392 |
Ralph Sutherland 5,003 |
George McIlraith (running in Ottawa Centre) | ||||||
| Stormont—Dundas | Tim Wees 5,409 |
Lucien Lamoureux 17,014 |
Lucien Lamoureux | |||||||
1965 - 27th General Election
 Map of the region's ridings in 1965. Colours show the result from the 1965 election |
|
| Electoral district | Candidates | Incumbent | ||||||||
|---|---|---|---|---|---|---|---|---|---|---|
| Liberal | PC | NDP | Other | |||||||
| Carleton | Lloyd Francis 31,523 |
Dick Bell 32,456 |
Donald Stirling 9,953 |
Lloyd Francis | ||||||
| Glengarry—Prescott | Viateur Éthier 10,339 |
Albert-R. Cadieux 6,529 |
Wilfrid Latreille 1,173 |
Raymond Berthiaume (Ral. Créd.) 1,204 |
Viateur Éthier | |||||
| Grenville—Dundas | John Palmer 6,930 |
Jean Casselman Wadds 9,845 |
René Benoit 595 |
Jean Wadds | ||||||
| Lanark | John Steele Kirkland 6,826 |
Desmond Code 9,784 |
Stanley Livingstone 775 |
William Hunter (S.C.) 335 |
George Doucett† | |||||
| Leeds | Ross Matheson 10,365 |
John MacLean 10,066 |
William F. Thompson 946 |
Ross Matheson | ||||||
| Ottawa East | Jean-Thomas Richard 15,107 |
Rex Le Lacheur 4,101 |
Ben Coffey 2,564 |
J.-T. Richard | ||||||
| Ottawa West | George McIlraith 14,945 |
Courtenay Evans 8,604 |
David John Weston 2,057 |
Angelo Tomasini (S.C.) 504 |
George McIlraith | |||||
| Russell | Paul Tardif 28,997 |
Ken Binks 15,718 |
Harold Wilson 7,186 |
Paul Tardif | ||||||
| Stormont | Lucien Lamoureux 13,530 |
Ken Bergeron 7,458 |
John Trew 3,201 |
Lucien Lamoureux | ||||||
1963 - 26th General Election
 Map of the region's ridings in 1963. Colours show the result from the 1963 election |
|
| Electoral district | Candidates | Incumbent | ||||||||||
|---|---|---|---|---|---|---|---|---|---|---|---|---|
| PC | Liberal | Social Credit | NDP | Other | ||||||||
| Carleton | Dick Bell 31,168 |
Lloyd Francis 32,325 |
Harold Herbert Splett 699 |
Lewis Hanley 3,144 |
Dick Bell | |||||||
| Glengarry—Prescott | J.-Marcel Gelineau 5,568 |
Viateur Éthier 9,906 |
Rolland Cholette 2,786 |
Peter Marcel Schneider 394 |
Raymond Bruneau (I Lib.) 1,234 |
Viateur Éthier | ||||||
| Grenville—Dundas | Jean Casselman 10,434 |
John Palmer 7,207 |
Reginald S. Libby 7,207 |
Jean Casselman | ||||||||
| Lanark | George Doucett 10,475 |
R. Arthur Stewart 7,043 |
Oscar Wilmot Ventress 312 |
James O. W. Griffith 601 |
George Doucett | |||||||
| Leeds | Frances D. MacOdrum 9,899 |
Ross Matheson 12,113 |
Ross Matheson | |||||||||
| Ottawa East | Rex Le Lacheur 3,964 |
J.-T. Richard 12,043 |
Roger Boulanger 930 |
Ruth Townsend 1,433 |
Yves Parisien (I Lib.) 6,574 Laurent Bordeleau (I P.C.) 349 |
J.-T. Richard | ||||||
| Ottawa West | Don Hueston 9,852 |
George McIlraith 18,634 |
F. D. Richardson 924 |
Brian E. Huggins 1,422 |
George McIlraith | |||||||
| Russell | Joe Poirier 14,892 |
Paul Tardif 31,182 |
Léo Cote 2,938 |
Harold B. Wilson 3,191 |
Paul Tardif | |||||||
| Stormont | John Alguire 9,728 |
Lucien Lamoureux 13,285 |
Ludger Boileau 851 |
Bill Kilger 801 |
Lucien Lamoureux | |||||||
1962 - 25th General Election
 Map of the region's ridings in 1962. Colours show the result from the 1962 election |
|
| Electoral district | Candidates | Incumbent | ||||||||||
|---|---|---|---|---|---|---|---|---|---|---|---|---|
| PC | Liberal | NDP | Social Credit | Other | ||||||||
| Carleton | Dick Bell 32,125 |
Lloyd Francis 26,109 |
Lewis Hanley 3,024 |
Harold Herbert Splett 922 |
Dick Bell | |||||||
| Glengarry—Prescott | Osie Villeneuve 8,186 |
Viateur Éthier 11,043 |
René Benoit 461 |
Rolland Cholette 639 |
Osie Villeneuve | |||||||
| Grenville—Dundas | Jean Casselman 10,159 |
Robert Watters 6,410 |
Reginald S. Libby 299 |
Grace Catherine Gough 258 |
Jean Casselman | |||||||
| Lanark | George Doucett 10,462 |
Vincent Kelly 6,823 |
Charles Ogilvie 410 |
R. H. James 660 |
George Doucett | |||||||
| Leeds | Jack Langmuir 10,325 |
Ross Matheson 12,071 |
Bill Hunter 424 |
Ross Matheson | ||||||||
| Ottawa East | Jean-Pierre Beaulne 6,801 |
J.-T. Richard 15,930 |
Marc Llanos 1,216 |
Wilfrid H. Wigney 534 |
J.-T. Richard | |||||||
| Ottawa West | Pat Kelly 11,397 |
George McIlraith 16,935 |
Walter Mann 1,538 |
F. D. Richardson 698 |
George McIlraith | |||||||
| Russell | Leo Kelly 15,492 |
Paul Tardif 29,322 |
Harold B. Wilson 3,385 |
Adrien Papineau 1,427 |
Paul Tardif | |||||||
| Stormont* | Grant Campbell 11,293 |
Lucien Lamoureux 11,363 |
Marjorie Ball 946 |
Mel Rowat 1,256 |
Grant Campbell | |||||||
- Note: Election held on July 16 due to the death of the Liberal candidate
1958 - 25th General Election
 Map of the region's ridings in 1958. Colours show the result from the 1958 election |
|
| Electoral district | Candidates | Incumbent | ||||||||
|---|---|---|---|---|---|---|---|---|---|---|
| PC | Liberal | CCF | Social Credit | |||||||
| Carleton | Dick Bell 32,741 |
George Humble 13,652 |
Stewart Crawford 1,777 |
Grace Gough 355 |
Dick Bell | |||||
| Glengarry—Prescott | Osie Villeneuve 10,385 |
Raymond Bruneau 9,865 |
Osie Villeneuve | |||||||
| Grenville—Dundas | Arza Casselman 10,793 |
Arthur Clark Casselman 4,340 |
R. H. James 473 |
Azra Casselman | ||||||
| Lanark | George Doucett 12,116 |
William Y. Wood 4,315 |
George Doucett | |||||||
| Leeds | Hayden Stanton 12,675 |
George Taylor Fulford 9,145 |
Hayden Stanton | |||||||
| Ottawa East | R.-D. Chenier 9,850 |
J.-T. Richard 17,161 |
William A. Layman 573 |
Raymond Berthiaume 357 |
J.-T. Richard | |||||
| Ottawa West | Charlotte Whitton 17,673 |
George McIlraith 19,098 |
James A. M. Allen 751 |
George McIlraith | ||||||
| Russell | Wib Nixon 19,464 |
Joseph-Omer Gour 21,575 |
Harry Jacks 1,224 |
Eddie Parisien 594 |
Joseph-Omer Gour | |||||
| Stormont | Grant Campbell 13,964 |
Albert Peter Lavigne 11,977 |
Mel Rowat 331 |
Albert Peter Lavigne | ||||||
1957 - 24th General Election
| Electoral district | Candidates | Incumbent | ||||||||||
|---|---|---|---|---|---|---|---|---|---|---|---|---|
| Liberal | PC | CCF | Social Credit | Other | ||||||||
| Carleton | Frank Egan Dunlap 15,298 |
Dick Bell 27,865 |
Stewart Crawford 1,334 |
Eric Kingsley Fallis 607 |
Vacant | |||||||
| Glengarry—Prescott | Raymond Bruneau 6,661 |
Osie Villeneuve 8,241 |
Patrice Brunet 198 |
René Bertrand (I. Lib) 5,414 |
Raymond Bruneau | |||||||
| Grenville—Dundas | Arthur Clark Casselman 4,402 |
Arza Clair Casselman 8,967 |
R. H. James 1,072 |
Azra Clair Casselman | ||||||||
| Lanark | W. Peter Burchell 4,504 |
William Gourlay Blair 11,629 |
William Gourlay Blair | |||||||||
| Leeds | George Taylor Fulford 10,125 |
Hayden Stanton 11,065 |
Charles William Shaw 395 |
Hayden Stanton | ||||||||
| Ottawa East | Jean-Thomas Richard 18,216 |
Eleanor Blackburn 5,947 |
William A. Layman 620 |
Raymond Berthiaume 843 |
Jean-Thomas Richard | |||||||
| Ottawa West | George McIlraith 19,434 |
Ethel T. Shaw 12,538 |
David Williams 1,062 |
Laurence M. Maloney 881 |
George McIlraith | |||||||
| Russell | Joseph-Omer Gour 20,673 |
Wib Nixon 12,271 |
Harry Jacks 1,420 |
Eddie Parisien 1,161 |
Joseph-Omer Gour | |||||||
| Stormont | Albert Lavigne 12,505 |
Grant Campbell 10,215 |
Mel Rowat 646 |
Albert Lavigne | ||||||||